The Battle for Talent
by Angelo Kostopoulos on June 30, 2015
In regions with knowledge-intensive industries, finding the right kind of talent to add to your organization is as challenging as ever. The demand for talent has placed pressure on human resource staff to identify the best candidates for each job. In order to meet that demand, the primary way the HR staff can really gauge the true value of each position available in an organization is to take a peek at other players’ cards and see what other organizations are giving for compensation and benefits for the same position. An excellent resource that you can use to gain access to this type of information is the HRA-NCA Benefits and Compensation Surveys. This will give you tangible data that explicitly outlines the benefits and compensation information for positions within peer organizations that have also participated in the survey.
What does this data have to do with hiring?
Incentivizing new talent can be a numbers game and if you don’t have the right number you might not get a chance to play. For example, did you know that according to the HRA-NCA Compensation and Benefits Survey Reports, the percentage of employers that use signing bonuses to attract qualified candidates to their organizations remained relatively flat from 2011 to 2013, but in 2014 that number increased by 5%? In addition to more organizations offering signing bonuses, the average signing bonus rose between 2013 and 2014 from $4,887 to $5,234 respectively.
So what is a potential candidate worth?
There are positions with pay rates that have risen faster than national industry averages, as well as positions with decreasing pay rates. Here are a few instances that illuminate the contrast in changing compensation rates.
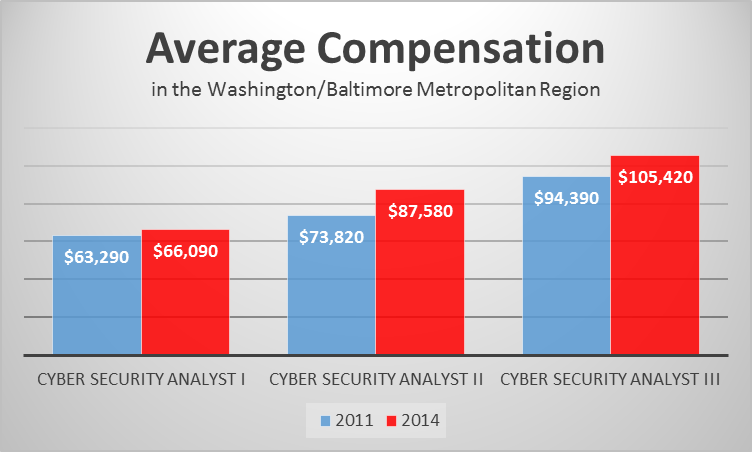
- In 2011 to 2014, the Cyber Security Analyst I’s average pay increased about 4.2% over the given timeframe, however the compensation accelerates dramatically for Cyber Security Analyst II & III, with average salaries increased by 15.7% and 10.5% respectively [1].
- Occupational Therapist II are having an increase in average pay, from $67,990 in 2011 to $75,750 in 2014, a 10.2% jump in compensation [2].
Having a concept of the supply and demand of positions in the local economy can help you tune in to the acceptable compensation range for the position openings within your organization. The saturation of supply for some positions has decreased their compensation rates, such as the rate for Licensed Practical Nurse (LPN) II that went from $46,830 to $45,620 in 2011 to 2014, a 2.7% decline [3].
The Take Away
Companies that are not paying attention to the value of candidates will only fill spots with under-skilled or underpaid staff that could leave within months for a company that offers more. Alternatively, they could overpay for candidates that are in high supply, leading to unnecessary spending. In order to entice and retain top talent while staying competitive across the spectrum of positions, it is imperative to be aware of the compensation and benefits being offered in the area by reviewing the median and average pay of positions your organization is looking to fill. There is a change in demand and supply, recognize the change and react accordingly.
[1] Cyber Security Analyst I, II and III job codes: ITCY211P1, ITCY212P2 and ITCY213P3
[2] Occupational Therapist II job code: HCTH232P2
[3] Licensed Practical Nurse (LPN) II job code: HCNU112S2


